Saturday, February 21, 2015

Elapsed Time

Image result for elapsed time


We have just finished out our unit on measurement. This included calculating elapsed time. Elapsed time is the time that elapses while some event is occurring. We learned a few different strategies to calculate this, including using a number line and a t-chart.


Here is an example of solving an elapsed time problem with regrouping of time:
Follow this link if you need a video refresher:

Homework this week will have your kiddo practicing this skill. Please let me know if you have any questions. Have a great week!

Friday, February 13, 2015

Week of 2/16/15

We have a busy, busy week coming up! Here is a look at what we will be doing:

Monday 2/16- No School

Tuesday 2/17- Math Benchmark;

  • This will be similar to the writing benchmark that Ms. Christian blogged about at the beginning of the month. It will be similar to the Math STAAR. I will use the data from this assessment to help guide me in reteaching, tutoring, and small group instruction. I want your kiddo to be as prepared as possible and this assessment will help me accomplish that. :)
Wednesday 2/18- Symphony Field Trip:

  • Be sure to have your kiddo wear their "best" dress. It is SO much fun to see everyone dressed up! This will be a morning trip. We will be back in time for our regular lunch.

Thursday 2/19- Reading Benchmark

  • This will help your kiddo and Ms. Christian prepare for the Reading STAAR.  

Friday 2/20- First regular day of the week! :)


Because this coming week is so hectic and the kiddos will be working so hard on the benchmark assessments, I am NOT assigning homework this week.

Please let me know if you have any questions or concerns! Have a great week!

Monday, February 9, 2015

Converting Metric Units of Measurement


The metric system is a comprehensive system of measurements used all over the world today. One of the biggest advantages that the metric system offers is that conversion between its units is simple and logical, as its units scale by powers of 10. Because of this, converting within metric measurements is usually as easy as multiplying or dividing a given measurement by a power of 10 to find the new value, or, as a shortcut, simply moving its decimal point.

The basic metric units are meters (for length), grams (for mass or weight), and liters (for volume).
There are many metric-unit prefixes, but the usual ones required in school are these: kilo-, hecto-, deka-, deci-, centi-, and milli-.


We are calculating metric conversions using the same basic conversion rule we used for the Customary System. Homework this week will have kiddos converting with both the Metric and Customary Systems. Please let me know if you have any questions!

Friday, January 30, 2015

Converting Customary Units of Measurement

We have been working on converting Customary Units of measurement this week in Math. In problems which involve measurements such as width, length, height, weight, capacity or temperature, it is often necessary to convert from one measurement unit to another.


Basic Conversion Rule:

To convert from a LARGER unit to a SMALLER unit...MULTIPLY

To convert from a SMALLER unit to a LARGER unit...DIVIDE


We have a rhyming saying that helps us remember this rule:


Complicating matters a bit is the fact that in the United States we have two different sets of measurement units.

Our basic system is the "customary" or "English" system.  In this system units include: inch, foot, yard, mile, ounce, pound, pint, quart, gallon and the Fahrenheit scale for temperature.

However, as we do business in the global community, the metric system is also a necessary system to understand. This system uses units such as: meter, centimeter, kilometer, gram, kilogram, liter, milliliter and the Celsius scale for temperature. We will delve into working with the metric system in the coming week.

Homework next week will consist of practicing these conversions. Here is a video you can watch if you want to see an example of a conversion.

Conversion Example

Please let me know if you have any questions!


Benchmarks Next Week

The time has come for our District Benchmark Tests in Reading and Writing. We will administer the Writing test next Tuesday and Wednesday. Reading Benchmark will be administered in a couple of weeks. Please have students get to bed early and have breakfast so they may be at their best! Thank you for your support!
Tuesday- 50% editing/revising and prompt 1
Wednesday- 50% editing/revising and prompt 2

***Early Release on Wednesday, February 4th. Students will be dismissed at 12:30pm. 

Sunday, January 25, 2015

Perimeter and Area

Last week we worked on perimeter and area. We focused quite a bit on the formulas that are used to find both.


Perimeter is the distance around a two-dimensional shape.

We focused on three formulas to find perimeter:

P = s + s + s (perimeter = side + side + side) - this formula can be sue on any shape


P = 4 x s (perimeter = 4 x side) - this formula works for squares


P = (2 x l) + (2 x w); perimeter = (2 x length) + (2 x width) - this formula works for rectangles


Area is the size of a surface or the amount of space inside the boundary of a flat (2-dimensional) object.

We focused on one formula to find the area of a rectangle:

A = l x w (area = length x width)


Follow this link if you want more clarification on calculating perimeter and area:


Homework this week will have your kiddo calculating perimeter and area. I expect them to write down the formula that they choose to use before they solve. Ask them about the three F's in math.

Please let me know if you have any questions! I am happy to help in any way I can!

Monday, January 19, 2015

Data Representations

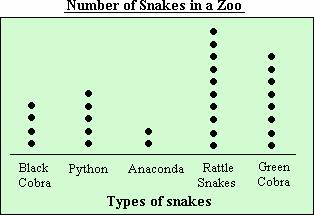
This week we have learned about three new ways to represent data. We have learned about dot plots, frequency tables, and stem-and-leaf plots.

A dot plot is a graphical display of data using dots. It is very similar to pictographs.


A frequency table is a table that shows a set of numbers/scores and their frequency (how many times each one occurs).

Frequency Distribution

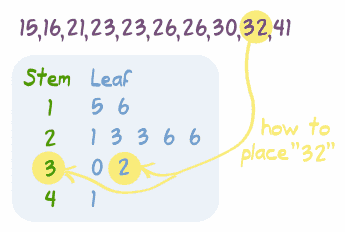
A stem-and-leaf plot is a plot where each data value is split into a "leaf" (usually the last digit) and a "stem" (the other digits). For example "32" is split into "3" (stem) and "2" (leaf). The "stem" values are listed down, and the "leaf" values are listed next to them. This way the "stem" groups the scores and each "leaf" indicates a score within that group.
Stem-and-Leaf Plot

Here are the basic steps to creating a stem-and-leaf plot:

Last week, we created these three data representations using data from final scores of the Dallas Cowboys games. They did a great job on this assignment and really seemed to enjoy it!

Homework this week will consist of something similar. Your kiddo will need to research some data (height of people, scores of game, age of friends, etc.) and create a dot plot, frequency table, and stem-and-leaf plot to represent this data. They will then need to come up with three questions that can be answered using this data. An example question might be: How many more students scored 80% or greater on the test than 70% or lower? This assignment will be due on Monday, January 26th. 

Please let me know if you have any questions!